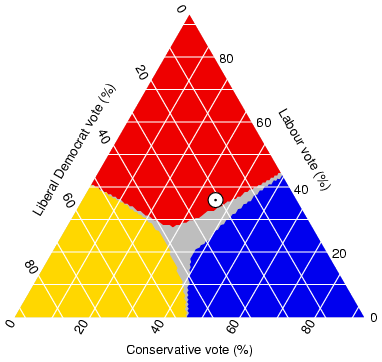
Triangular plots are often used by scientists and engineers, but anyone can use them to show usually three variables (but can be more variables) of data graphically. This triangular plot is an analysis of votes in the UK. The different variables in this case, are the different parties in the upcoming election.
http://ex-parrot.com/~chris/images/20050407/triangle.png

No comments:
Post a Comment