Saturday, January 24, 2009

DOQQ


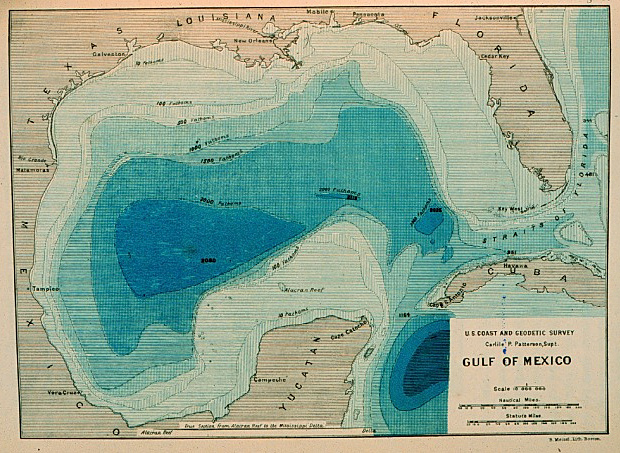
Digital orthoimagery quarter quadrangle is a computer generated image of an aerial photograph. They can be in black and white, natural color, or infrared. This DOQQ is an image of a portion of Washington, DC.

http://seamless.usgs.gov/website/seamless/products/1mdoqq.jpg

Friday, January 23, 2009

Box Plot


A box plot is a way of distributing numerical data graphically. This example is of biometric scores in June of 2005.

http://www.epa.gov/volunteer/stream/images/fig64.jpg

Bathymetric Map


A bathymetric map is a type of topographic or contour map that shows sea floor elevations. This is a map of the floor of the Gulf of Mexico.

http://celebrating200years.noaa.gov/events/survey/gulf_of_mexico650.jpg

Topographic Map


I think this is a very interesting map. It shows the earth as a living organism with the greenery. This is a topographical satellite map.

http://worldmapsonline.com/SatPosters/LivingEarth.jpg

Tuesday, January 13, 2009

Dot Density/Distribution Map


http://cartophilia.com/blog/images/popdensity.jpg

Dot density maps are a type of point pattern map. It is a nonproportional point symbol that does not vary in size. One dot represents 10,000 people. This particular dot distribution map is used to show the populations in the United States in the year 2000.

Sunday, January 11, 2009

yay i figured this out

I still have to post my first map. I'm just glad I figured this thing out :o)